


The global silica pricing landscape in Q1 2026 reflected a moderately stable yet regionally varied trend, supported by steady industrial demand and supply adjustments. The Silica Price Index indicates a slight upward movement of approximately 3–5% compared to Q4 2025, particularly in Europe and Asia.
In Q1 2026, prices ranged from USD 57/MT in the USA to USD 88/MT in Germany, highlighting regional cost differences influenced by production and logistics. China reported USD 80/MT, while Saudi Arabia and Turkey stood at USD 65/MT and USD 78/MT, respectively. These variations provide a clear snapshot of global pricing direction supported by data from IMARC Group.
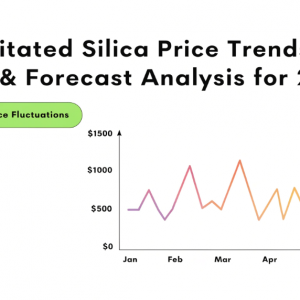
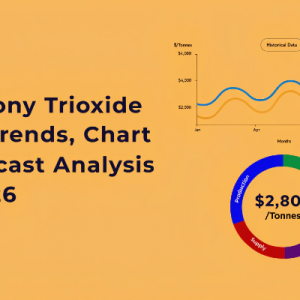
Silica Price Chart Q1 2026 Analysis
The Silica Price Chart for Q1 2026 shows a gradual upward trajectory across most regions. Prices remained relatively stable in January, followed by a slight increase in February due to improved downstream demand. March witnessed peak pricing in Europe, especially Germany at USD 88/MT.
Compared to Q4 2025, where prices were slightly lower due to year-end inventory adjustments, Q1 2026 showed improved consistency. The lowest price point was recorded in the USA at USD 57/MT, while Germany marked the highest level.
This trend reflects balanced supply conditions and consistent consumption from construction, glass, and electronics sectors. The data-driven movement in the chart highlights predictable pricing behavior, making it easier for procurement planning.
Silica Price Trend Q1 2026
The silica price trend during Q1 2026 remained moderately positive, supported by steady industrial usage and controlled supply levels. Growth was not aggressive but consistent across major economies.
Asia-Pacific showed stable demand, particularly from manufacturing and infrastructure activities. Europe experienced slightly stronger upward pressure due to higher production costs, while North America maintained relatively stable pricing due to sufficient supply availability.
Overall, the quarter reflected a balanced situation where neither sharp spikes nor steep declines were observed, making it a stable phase for buyers and suppliers.
Regional Price Analysis
North America
In North America, silica prices remained relatively low and stable, with the USA reporting USD 57/MT. The region benefited from abundant raw material availability and efficient production systems, which kept costs controlled. Demand from construction and industrial applications remained steady without significant fluctuations.
Europe
Europe recorded the highest pricing levels, particularly in Germany at USD 88/MT. This was driven by higher energy and operational costs. The region also experienced consistent demand from glass and automotive sectors, contributing to firm price levels throughout the quarter.
Asia-Pacific
Asia-Pacific showed mixed pricing trends, with China at USD 80/MT. Strong manufacturing activity supported demand, while stable supply kept prices from rising sharply. The region maintained a balanced position, making it a key contributor to global supply.
Middle East
Saudi Arabia reported USD 65/MT, reflecting cost advantages in production and proximity to raw materials. Stable industrial demand supported consistent pricing across the quarter.
Turkey
Turkey recorded USD 78/MT, showing moderate pricing influenced by regional demand and trade activities. The country maintained stable supply conditions, preventing major price fluctuations.
Regional Price Snapshot (Q1 2026)
- USA: USD 57/MT
- China: USD 80/MT
- Germany: USD 88/MT
- Saudi Arabia: USD 65/MT
- Turkey: USD 78/MT
This data highlights a clear pricing gap between low-cost producing regions and higher-cost industrial economies. While North America remained the most cost-effective, Europe led in pricing due to operational expenses. Asia and the Middle East maintained balanced positions, ensuring global supply stability.
Key Market Drivers
- Stable demand from construction and infrastructure sectors
- Consistent consumption in glass and electronics industries
- Balanced global supply with no major disruptions
- Regional production cost differences influencing price gaps
- Improved logistics and transportation efficiency
- Steady industrial growth in Asia-Pacific
- Energy cost variations impacting European pricing
Silica Price Forecast 2026
The silica price forecast 2026 suggests a stable to slightly upward trend for the remainder of the year. Prices are expected to remain supported by steady demand from key industries such as construction, automotive, and electronics.
Moderate increases may occur in regions with higher production costs, particularly in Europe. However, strong supply availability in Asia and the Middle East is likely to prevent sharp price spikes.
Overall, the outlook indicates a balanced pricing environment with gradual growth rather than volatility.
Silica Price Index & Historical Comparison
The Silica Price Index reflects a stable pricing pattern over the past few quarters. Compared to Q4 2025, Q1 2026 showed a modest increase of around 3–5%, indicating gradual recovery and stabilization.
Historically, silica prices have remained relatively steady due to consistent demand across industries. The silica price history chart shows limited volatility, making it a predictable commodity for procurement planning.
IMARC Group data suggests that current pricing aligns with long-term trends, where steady growth is observed rather than sudden fluctuations.
Impact on Related Markets
Silica pricing directly affects several downstream industries. The glass manufacturing sector experiences cost adjustments based on silica price movement. Similarly, construction materials such as cement and concrete are influenced by pricing changes.
Electronics and semiconductor industries also rely on silica, making pricing stability important for production planning. Any shift in silica costs can impact overall manufacturing expenses across these sectors.
? Get real-time Silica price insights
Stay ahead in the market with accurate data, forecasts, and regional pricing trends to optimize your sourcing strategy.
https://www.imarcgroup.com/silica-pricing-report/requestsample
FAQs About Silica Price Trends Analysis & Market Insights:
What does the Silica Price Chart indicate for Q1 2026?
The silica price chart shows a stable-to-slightly upward trend, with gradual increases across most regions due to steady demand and balanced supply.
How is the Silica Price Index calculated?
The silica price index is calculated based on average regional prices, supply-demand balance, and historical price trends, helping to track overall price movements.
What is the silica price forecast for 2026?
The silica price forecast for 2026 suggests stable growth with minor increases, supported by consistent industrial demand and steady supply conditions.
Conclusion
Silica prices in Q1 2026 remained stable with slight upward movement across key regions. Europe recorded the highest levels, while North America maintained the lowest pricing. Asia and the Middle East showed balanced trends, supporting global supply.
The overall outlook for 2026 indicates steady growth with minimal volatility. With consistent demand across industries, silica pricing is expected to remain predictable, making it easier for businesses to plan procurement and manage costs effectively.
.
Contact Us:
IMARC Group
134 N 4th St., Brooklyn, NY 11249, USA
Email: sales[@]imarcgroup.com
Tel NoD) +91 120 433 0800
United States: +1-201971-6302