


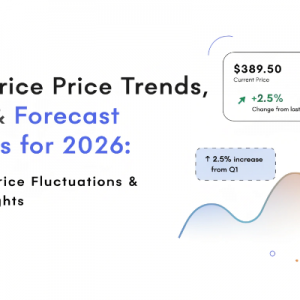


Early 2026 reflected a steady yet slightly uneven Hexane Price Index across key regions, with pricing influenced by feedstock costs and regional demand cycles. The Hexane Price Chart indicated a mild upward trend in Asia and North America, while Europe showed relatively stable to soft movement. In Q1 2026, prices reached USD 1652/MT in the USA and USD 1492/MT in India, while China stood at USD 1187/MT. South Korea recorded the highest level at USD 1876/MT, reflecting a 5–7% increase compared to Q4 2025, while Germany remained lower at USD 1029/MT with minimal fluctuation.
Hexane Price Chart Analysis: Monthly and Quarterly Breakdown
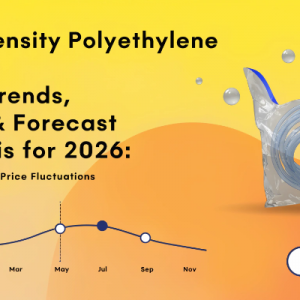
The Hexane Price Chart for Q1 2026 shows a gradual rise from January through March in most regions. January began with stable pricing due to balanced supply. By February, slight increases were observed, particularly in Asia-Pacific region, driven by improved industrial demand.
March marked the peak of the quarter, especially in South Korea, where prices climbed due to tighter supply and higher feedstock costs. The lowest price point was recorded in Germany, reflecting softer demand and stable inventories. Compared to Q4 2025, where prices remained mostly flat, Q1 2026 demonstrated a modest upward shift, particularly in export-driven regions.
Hexane Price Trend Q1 2026: Global Direction Explained
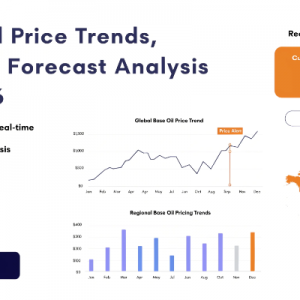
Across global markets, the Hexane price trend showed controlled growth with regional variations. Asia-Pacific led the upward movement due to strong manufacturing demand, while North America followed with moderate increases supported by steady consumption.
Europe remained relatively subdued, as industrial activity was stable and supply levels were sufficient. Overall, the trend suggested a balanced environment where demand slightly outpaced supply in select regions, leading to gradual price increases rather than sharp spikes.
Regional Price Snapshot: Q1 2026
|
Region |
Price (USD/MT) |
|
USA |
1652 |
|
China |
1187 |
|
Germany |
1029 |
|
South Korea |
1876 |
|
India |
1492 |
Regional pricing highlights clear differences driven by production costs and demand intensity. South Korea recorded the highest prices due to strong industrial demand and limited supply flexibility. The USA and India maintained mid-range levels, supported by stable consumption patterns. China remained competitive with lower pricing due to efficient production. Germany stood out as the lowest-priced region, reflecting balanced supply and moderate demand conditions.
Regional Price Analysis: Key Market Dynamics
North America: Steady Demand with Gradual Increase
Industrial usage, particularly in extraction and chemical processing, supported stable demand. Prices rose slightly due to feedstock cost pressures and consistent consumption patterns.
Europe: Balanced Supply Keeping Prices Stable
European markets showed minimal volatility. Adequate supply and steady industrial activity kept prices relatively low compared to other regions, especially in Germany.
Asia-Pacific: Strong Demand Driving Growth
Asia-Pacific experienced the most noticeable upward movement. Countries like South Korea and India saw stronger demand from manufacturing sectors, which pushed prices higher. China remained stable due to efficient supply chains and production capacity.
Key Market Drivers Influencing Prices
- Fluctuations in crude oil and feedstock prices
- Demand from edible oil extraction and industrial solvents
- Regional supply availability and production efficiency
- Export demand from Asia-Pacific countries
- Logistics and transportation cost variations
- Industrial activity levels across major economies
- Seasonal demand shifts in chemical processing industries
Hexane Price Forecast 2026: Expected Market Direction
The Hexane price forecast 2026 indicates a stable to slightly upward trajectory. Prices are expected to remain firm in Asia-Pacific due to ongoing demand from industrial sectors. North America may experience gradual increases as consumption remains consistent.
Europe is likely to maintain stable pricing unless significant supply disruptions occur. Based on insights aligned with IMARC Group analysis, overall prices could increase by 2–5% through the year, supported by steady demand and moderate cost pressures.
Hexane Price Index & Historical Comparison
The Hexane Price Index helps track pricing movement over time and compare current levels with past trends. When reviewing the Hexane Historical Price Chart, it is evident that prices remained stable throughout 2024 and early 2025, followed by a gradual increase in late 2025.
Q1 2026 continues this upward trajectory, particularly in Asia-Pacific regions. The hexane price history chart suggests a consistent pattern of moderate growth rather than volatility, indicating a stable supply-demand balance over time.
Impact on Related Markets
Changes in hexane pricing directly affect industries such as edible oil extraction, pharmaceuticals, and adhesives. Higher prices may increase production costs for vegetable oil processors, especially in regions dependent on imports.
The pharmaceutical sector could also experience slight cost adjustments due to hexane’s role as a solvent. Additionally, adhesives and coatings industries may face marginal cost increases, depending on regional price movements.
FAQs About Hexane Price Trend & Market Insights:
What Does the Hexane Price Chart Show for Q1 2026?
The Hexane Price Chart shows a gradual upward trend in most regions, with Asia-Pacific leading the increase while Europe remained relatively stable.
How Is the Hexane Price Index Calculated?
The Hexane Price Index is calculated using regional price averages, supply-demand balance, and production costs, helping track pricing trends over time.
What Does the Hexane Historical Price Chart Indicate?
The Hexane Historical Price Chart indicates stable pricing during 2024–2025, followed by a gradual increase into Q1 2026, reflecting steady demand growth.
Stay Ahead with Latest Price Trends – Grab Your Sample Today:
https://www.imarcgroup.com/hexane-pricing-report/requestsample
Conclusion: Data-Driven Outlook for 2026
Q1 2026 highlighted a stable yet slightly rising pricing environment for hexane across global markets. Asia-Pacific led growth, while Europe maintained balance with lower prices.
The overall hexane price trend suggests moderate upward movement supported by steady demand and manageable supply conditions. Looking ahead, prices are expected to remain stable with gradual increases, making it essential for businesses to monitor regional variations and cost factors closely.
Contact Us:
IMARC Group
134 N 4th St. Brooklyn, NY 11249, USA
Email: sales[@]imarcgroup.com
Tel NoD) +91 120 433 0800
United States: +1-201971-6302